


Call Statistics
This section shows the number of calls, the percentage of successful and unsuccessful connections, and a breakdown of short and long calls.
To open call statistics, go to the "Statistics" mode.
Why you need this statistics
With call statistics, you can:
- see the overall connection rate across the company and its dynamics by day, month, or year;
- compare connection rates by different telephony plugins;
- identify operators making the fewest calls;
- check how many short calls each operator has and what is their average call duration.
What data is the statistics based on
Call statistics are based on the date the call was made in SalesRender and by default are displayed broken down by day.
A made call is any call attempt that was successfully initiated, regardless of whether the client answered or not.
Calls that instantly fail with an error (due to negative balance or invalid credentials) are not counted.
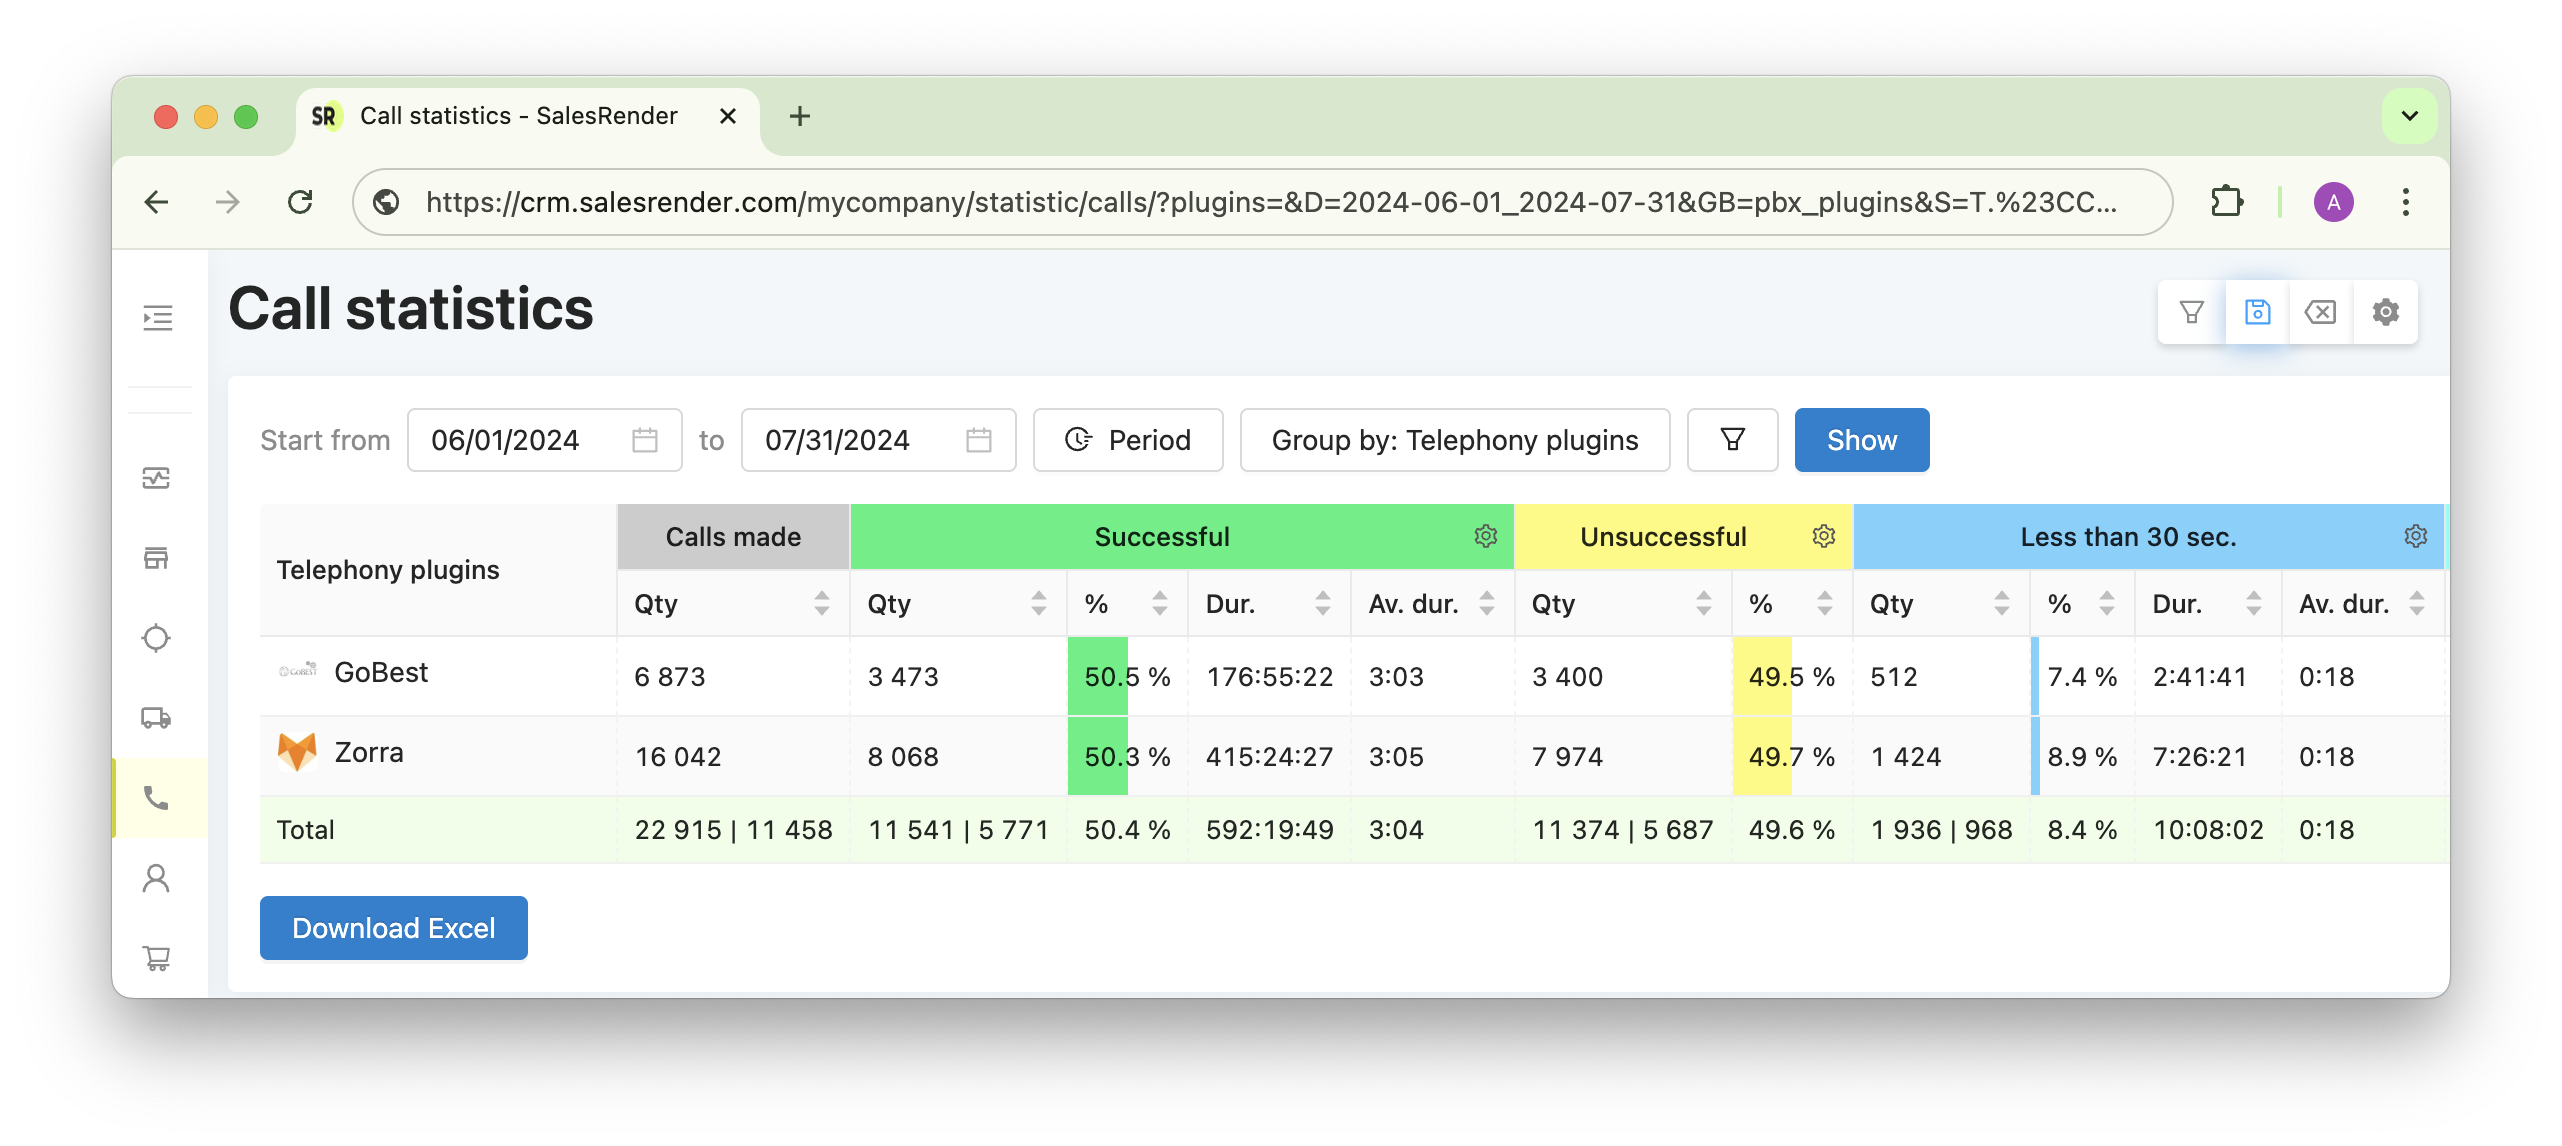
What do the columns in the statistics mean
- Calls Made shows the number of calls made on that day or by any selected grouping. For example, if you group by telephony plugin, the counter shows the number of calls through that plugin in the selected period.
Important: The counter includes any successfully initiated outgoing call, regardless of whether someone picked up. Incoming calls are not counted here.
Connected shows the number of calls where the client or their answering machine picked up. Alongside the count, it shows the percentage of such calls, as well as total and average call durations.
Not Connected shows the number and percentage of calls where there was no answer. Instant errors (due to negative balance or invalid login data) are not counted here.
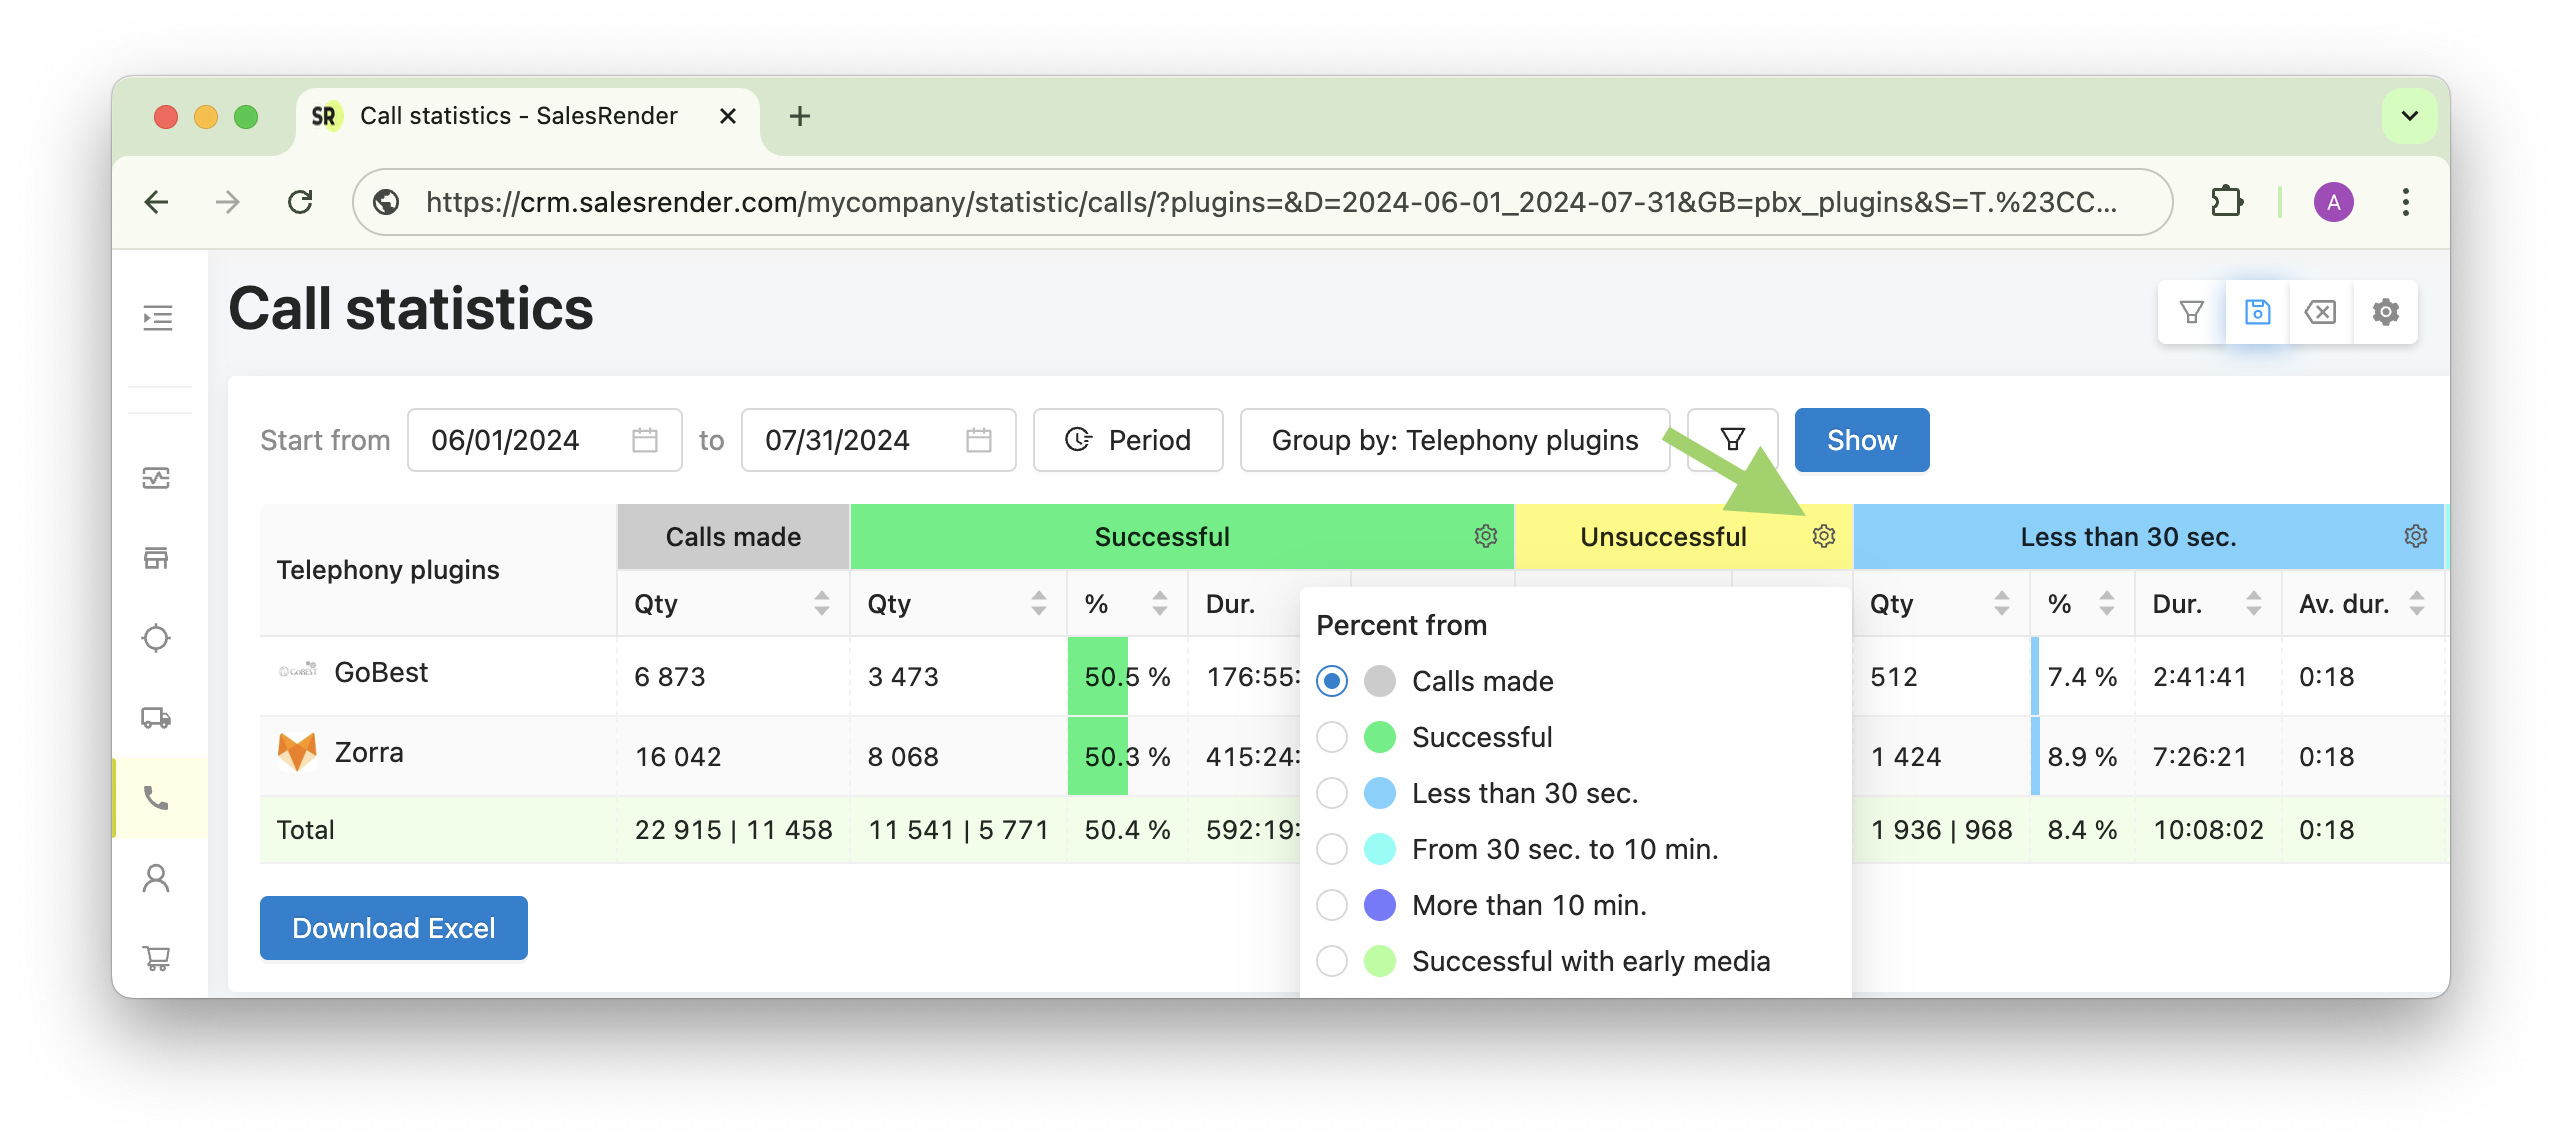
Less than 30 sec helps track short calls, which are most likely non-target calls (like answering machines or "wrong number"). If an operator has a lot of calls under 30 seconds, it may be a reason to look closer at their call details.
The percentage is calculated relative to all calls made, but you can change this in the "Percentage" column settings.
30 sec to 10 min is most likely where your most effective calls are. That's why we highlight it separately together with the average call duration.
More than 10 min helps track very long calls, which may also be a reason to look closer at an operator’s call details.
Ringing shows how much time was spent on ringing (split by connected and not connected calls).
Do you need to configure this statistics?
Unlike statistics based on order statuses (where you may need to merge or exclude statuses), call statistics do not require customization.
Of course, you can remove unnecessary columns, but there aren’t many, and in our opinion, they’re all very important.
What filters and groupings are available
At the moment, you can filter by telephony plugins to view statistics for a specific provider.
Groupings include by day/month/year, by projects, offers, telephony plugins, and users.
Can you download the statistics?
Yes, there is a "Download Excel" button below the statistics table.
We are actively working on adding more statistics. Please write to us if you have suggestions 
Subscribe to our Telegram channel to stay up to date.
Have questions? Contact our CEO Anna directly.
Thank you for being with us 


