

Telepresence Schedule
Want fewer “idle hours” and more discipline in your call center?
SalesRender offers a powerful tool to monitor and analyze your agents’ work — the Telepresence Chart.
 What it is
The Telepresence Chart in SalesRender is a visual tool for tracking operator activity over the past 30 days.
It clearly shows who worked and when, broken down by user and date.
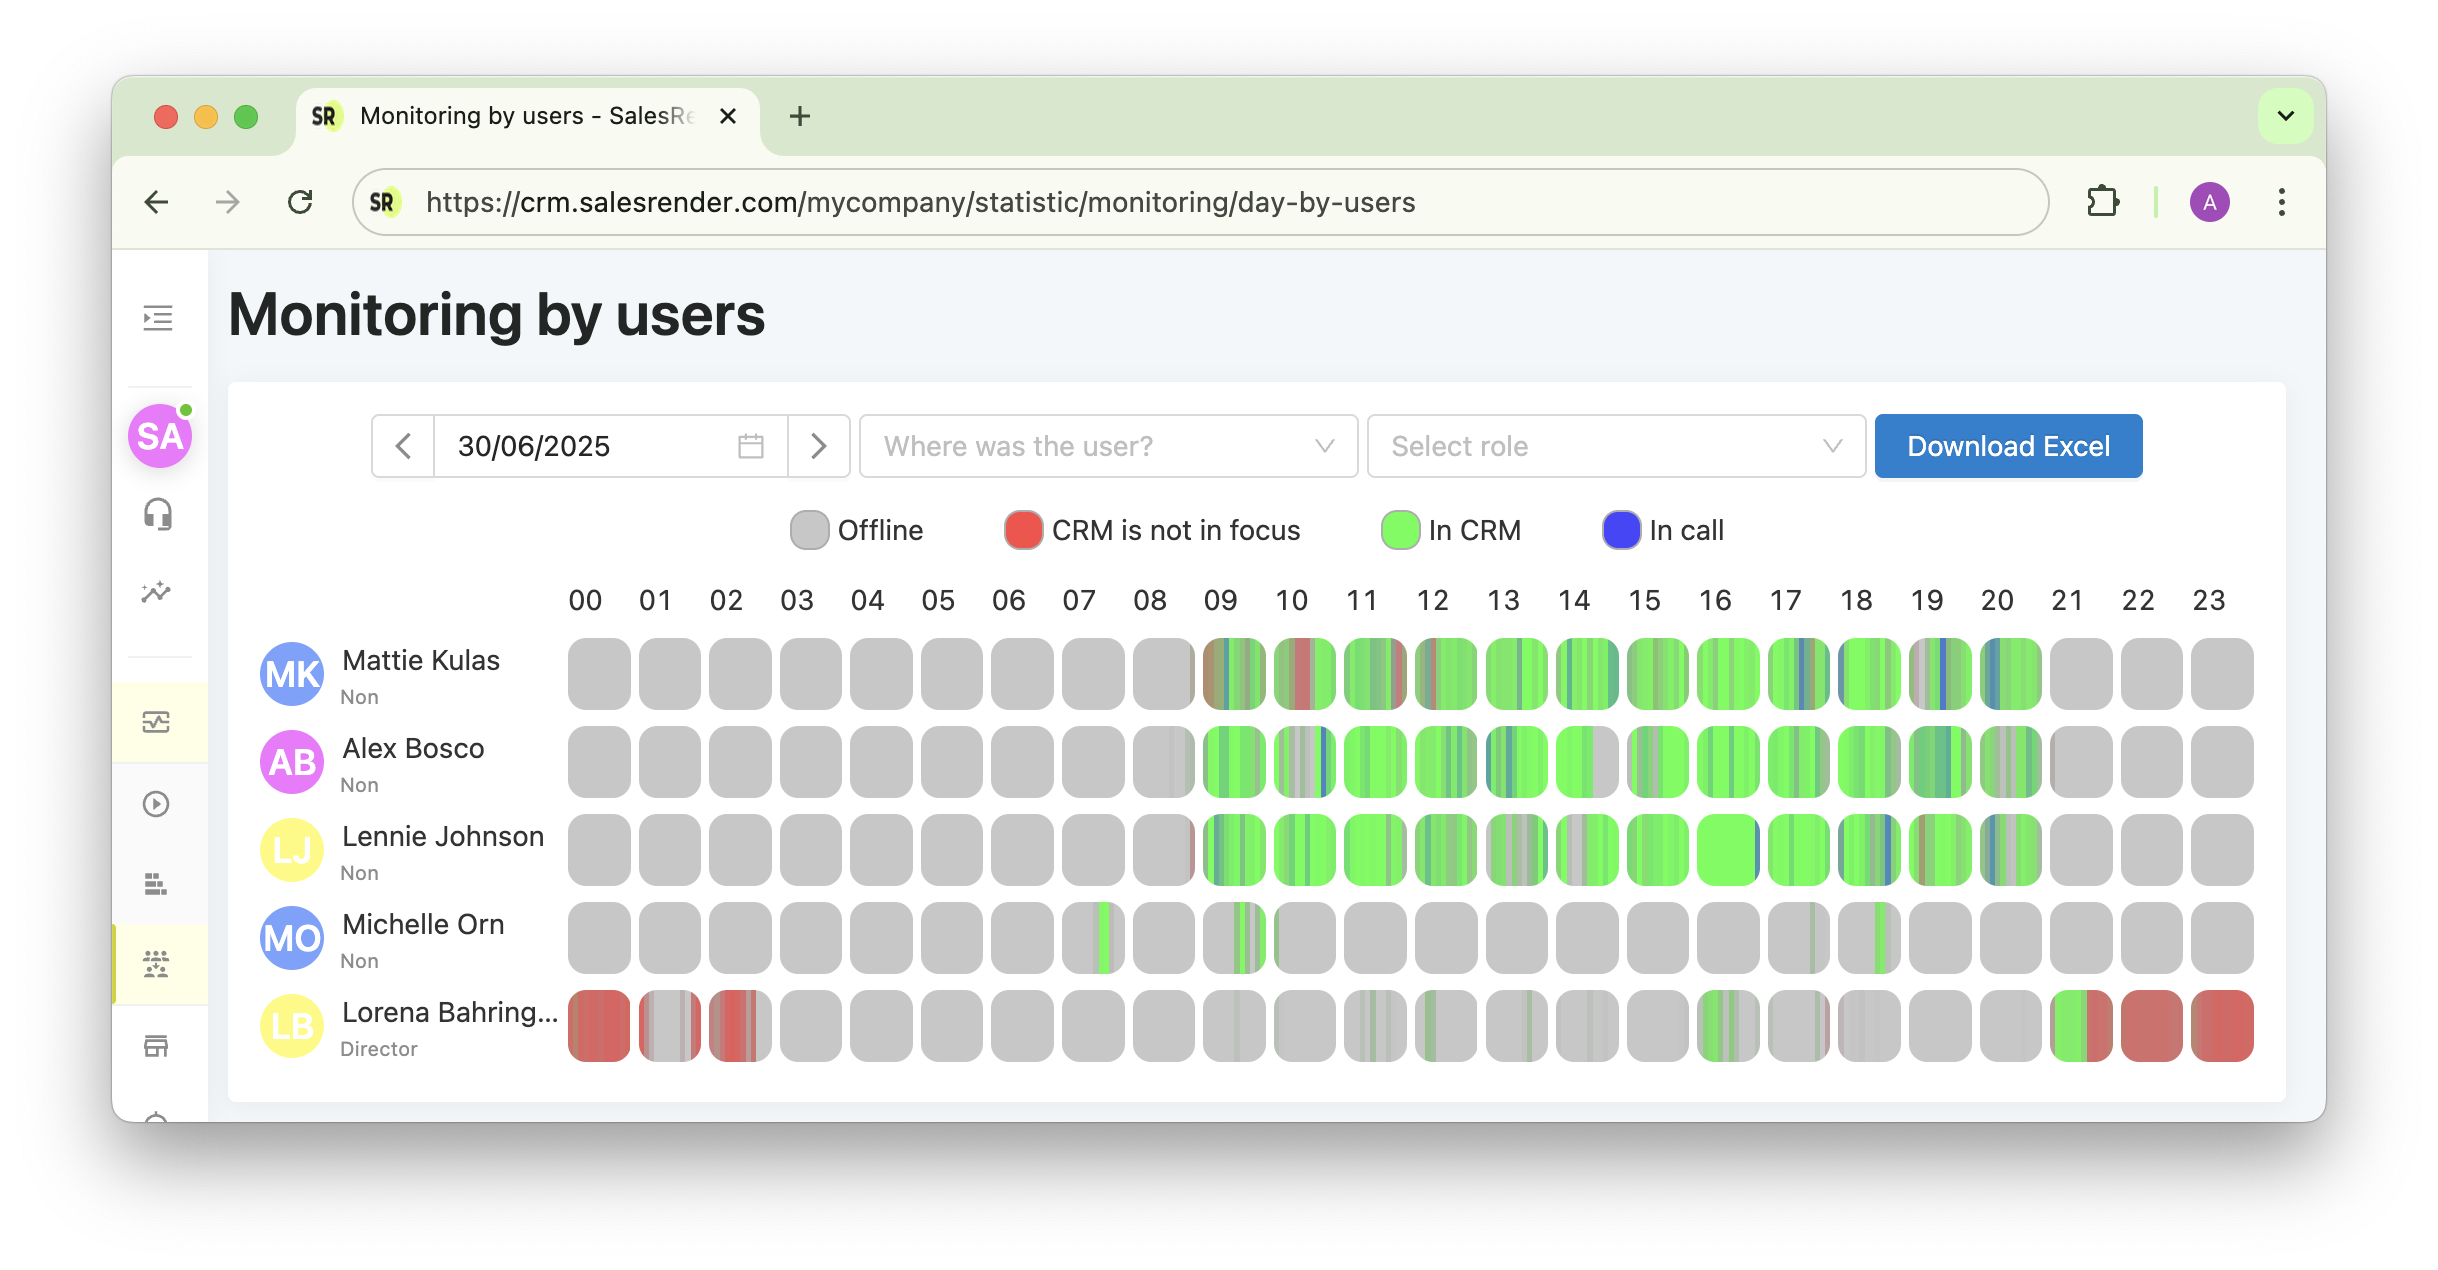
It uses color-coded statuses for clarity:
 In CRM — the agent is actively working in the CRM system.
 On call — the agent is talking to customers.
 CRM not in focus — the user has switched to another window, such as a browser tab or messenger app.
Colors can blend together if different activities happened in quick succession.
 Hover for details
Hover over any section of the chart to instantly see:
 What CRM page the agent is on.
 What entity they’re editing (lead, order, or customer record).
 How much time was spent on this action.

You can also apply filters to display only visits to specific CRM pages — for example, time spent viewing reports or editing orders.
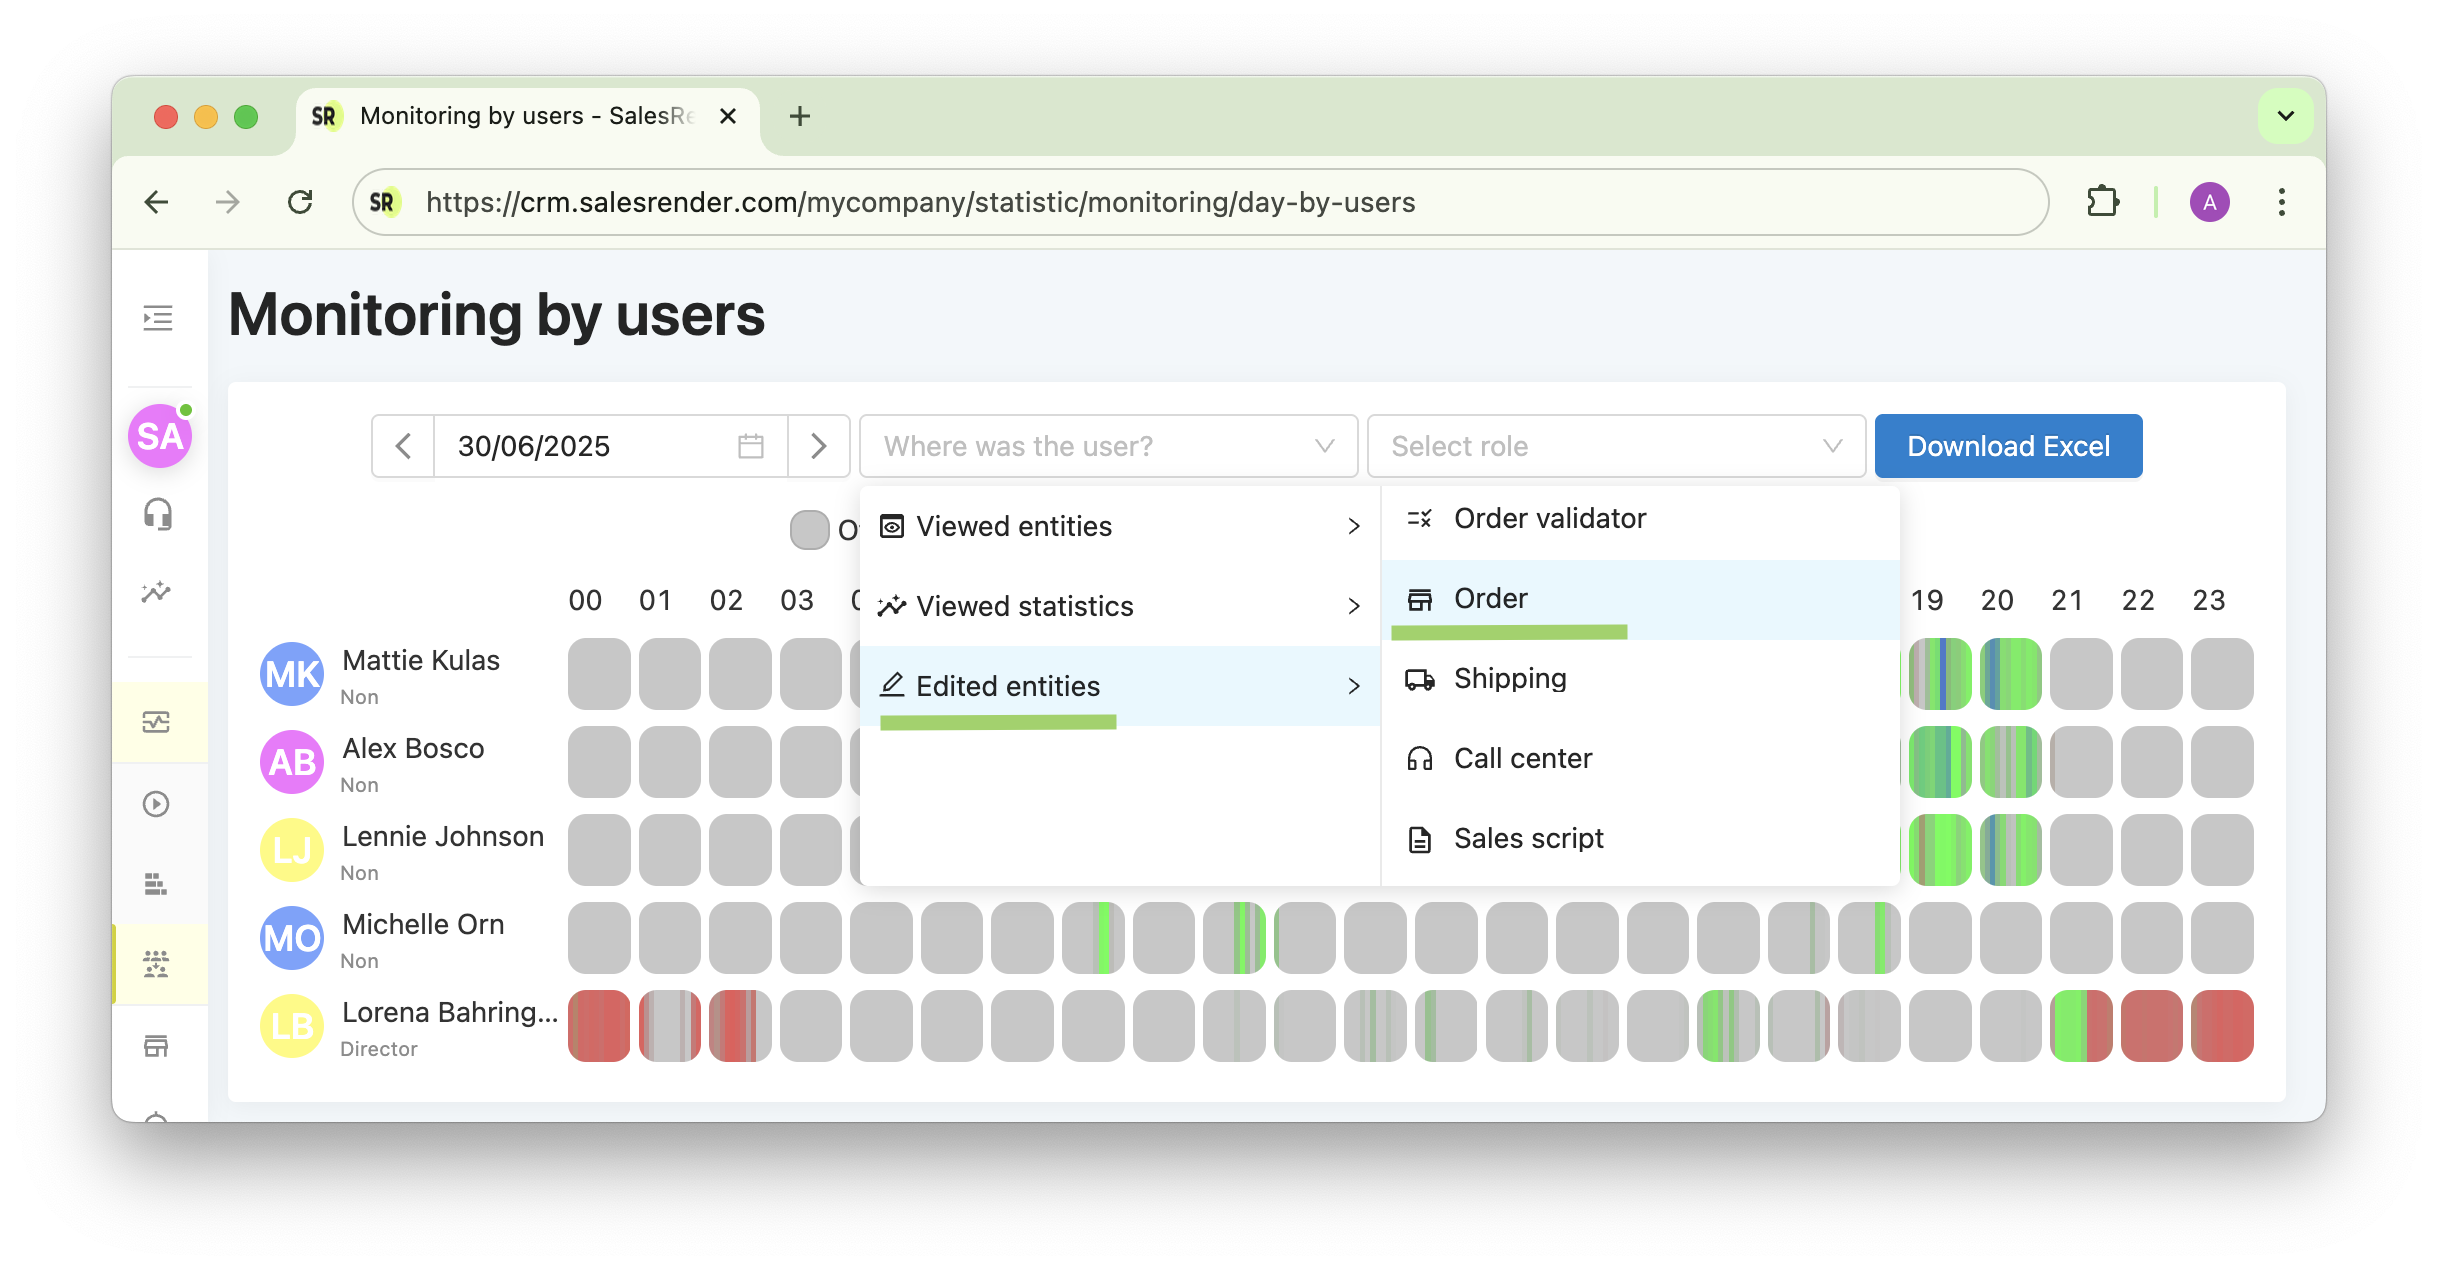
Additionally, filter users by role, so you can focus on agents, supervisors, or any other group.
 Why it matters
 Visualizes agents’ work patterns — see their minute-by-minute activity.
- Shows productive hours — how much time goes to calls, CRM work, or non-work windows.
 Drives discipline — employees know their workflow is transparent.
All of this is available right inside SalesRender.
It takes just 3 minutes to see which agents are truly working.
You can also download the data to Excel for long-term storage, since CRM data is kept for 45 days.
Have questions about this feature? Let us know!
Subscribe to our Telegram channel to stay up to date.
Have questions? Contact our CEO Anna directly.
Thank you for being with us 

